A plottable representing a financial stock chart. More...
Public Types | |
| enum | WidthType { wtAbsolute , wtAxisRectRatio , wtPlotCoords } |
| Defines the ways the width of the financial bar can be specified. More... | |
| enum | ChartStyle { csOhlc , csCandlestick } |
| Defines the possible representations of OHLC data in the plot. More... | |
Public Member Functions | |
| QCPFinancial (QCPAxis *keyAxis, QCPAxis *valueAxis) | |
| Constructs a financial chart which uses keyAxis as its key axis ("x") and valueAxis as its value axis ("y"). | |
| QSharedPointer< QCPFinancialDataContainer > | data () const |
| Returns a pointer to the internal data storage of type QCPFinancialDataContainer. | |
| ChartStyle | chartStyle () const |
| double | width () const |
| WidthType | widthType () const |
| bool | twoColored () const |
| QBrush | brushPositive () const |
| QBrush | brushNegative () const |
| QPen | penPositive () const |
| QPen | penNegative () const |
| void | setData (QSharedPointer< QCPFinancialDataContainer > data) |
| This is an overloaded member function, provided for convenience. It differs from the above function only in what argument(s) it accepts.Replaces the current data container with the provided data container. | |
| void | setData (const QVector< double > &keys, const QVector< double > &open, const QVector< double > &high, const QVector< double > &low, const QVector< double > &close, bool alreadySorted=false) |
| This is an overloaded member function, provided for convenience. It differs from the above function only in what argument(s) it accepts.Replaces the current data with the provided points in keys, open, high, low and close. | |
| void | setChartStyle (ChartStyle style) |
| Sets which representation style shall be used to display the OHLC data. | |
| void | setWidth (double width) |
| Sets the width of the individual bars/candlesticks to width in plot key coordinates. | |
| void | setWidthType (WidthType widthType) |
| Sets how the width of the financial bars is defined. | |
| void | setTwoColored (bool twoColored) |
| Sets whether this chart shall contrast positive from negative trends per data point by using two separate colors to draw the respective bars/candlesticks. | |
| void | setBrushPositive (const QBrush &brush) |
| If setTwoColored is set to true, this function controls the brush that is used to draw fills of data points with a positive trend (i.e. | |
| void | setBrushNegative (const QBrush &brush) |
| If setTwoColored is set to true, this function controls the brush that is used to draw fills of data points with a negative trend (i.e. | |
| void | setPenPositive (const QPen &pen) |
| If setTwoColored is set to true, this function controls the pen that is used to draw outlines of data points with a positive trend (i.e. | |
| void | setPenNegative (const QPen &pen) |
| If setTwoColored is set to true, this function controls the pen that is used to draw outlines of data points with a negative trend (i.e. | |
| void | addData (const QVector< double > &keys, const QVector< double > &open, const QVector< double > &high, const QVector< double > &low, const QVector< double > &close, bool alreadySorted=false) |
| This is an overloaded member function, provided for convenience. It differs from the above function only in what argument(s) it accepts.Adds the provided points in keys, open, high, low and close to the current data. | |
| void | addData (double key, double open, double high, double low, double close) |
| This is an overloaded member function, provided for convenience. It differs from the above function only in what argument(s) it accepts.Adds the provided data point as key, open, high, low and close to the current data. | |
| virtual QCPDataSelection | selectTestRect (const QRectF &rect, bool onlySelectable) const Q_DECL_OVERRIDE |
| Returns a data selection containing all the data points of this plottable which are contained (or hit by) rect. | |
| virtual double | selectTest (const QPointF &pos, bool onlySelectable, QVariant *details=0) const Q_DECL_OVERRIDE |
| Implements a point-selection algorithm assuming the data (accessed via the 1D data interface) is point-like. | |
| virtual QCPRange | getKeyRange (bool &foundRange, QCP::SignDomain inSignDomain=QCP::sdBoth) const Q_DECL_OVERRIDE |
| Returns the coordinate range that all data in this plottable span in the key axis dimension. | |
| virtual QCPRange | getValueRange (bool &foundRange, QCP::SignDomain inSignDomain=QCP::sdBoth, const QCPRange &inKeyRange=QCPRange()) const Q_DECL_OVERRIDE |
| Returns the coordinate range that the data points in the specified key range (inKeyRange) span in the value axis dimension. | |
 Public Member Functions inherited from QCPAbstractPlottable1D< QCPFinancialData > Public Member Functions inherited from QCPAbstractPlottable1D< QCPFinancialData > | |
| QCPAbstractPlottable1D (QCPAxis *keyAxis, QCPAxis *valueAxis) | |
| Forwards keyAxis and valueAxis to the QCPAbstractPlottable constructor and allocates the mDataContainer. | |
| virtual int | dataCount () const Q_DECL_OVERRIDE |
| Returns the number of data points of the plottable. | |
| virtual double | dataMainKey (int index) const Q_DECL_OVERRIDE |
| Returns the main key of the data point at the given index. | |
| virtual double | dataSortKey (int index) const Q_DECL_OVERRIDE |
| Returns the sort key of the data point at the given index. | |
| virtual double | dataMainValue (int index) const Q_DECL_OVERRIDE |
| Returns the main value of the data point at the given index. | |
| virtual QCPRange | dataValueRange (int index) const Q_DECL_OVERRIDE |
| Returns the value range of the data point at the given index. | |
| virtual QPointF | dataPixelPosition (int index) const Q_DECL_OVERRIDE |
| Returns the pixel position on the widget surface at which the data point at the given index appears. | |
| virtual bool | sortKeyIsMainKey () const Q_DECL_OVERRIDE |
| Returns whether the sort key (dataSortKey) is identical to the main key (dataMainKey). | |
| virtual QCPDataSelection | selectTestRect (const QRectF &rect, bool onlySelectable) const Q_DECL_OVERRIDE |
| Implements a rect-selection algorithm assuming the data (accessed via the 1D data interface) is point-like. | |
| virtual int | findBegin (double sortKey, bool expandedRange=true) const Q_DECL_OVERRIDE |
| Returns the index of the data point with a (sort-)key that is equal to, just below, or just above sortKey. | |
| virtual int | findEnd (double sortKey, bool expandedRange=true) const Q_DECL_OVERRIDE |
| Returns the index one after the data point with a (sort-)key that is equal to, just above, or just below sortKey. | |
| virtual double | selectTest (const QPointF &pos, bool onlySelectable, QVariant *details=0) const Q_DECL_OVERRIDE |
| Implements a point-selection algorithm assuming the data (accessed via the 1D data interface) is point-like. | |
| virtual QCPPlottableInterface1D * | interface1D () Q_DECL_OVERRIDE |
| Returns a QCPPlottableInterface1D pointer to this plottable, providing access to its 1D interface. | |
| Public Member Functions inherited from QCPAbstractPlottable | |
| QCPAbstractPlottable (QCPAxis *keyAxis, QCPAxis *valueAxis) | |
| Constructs an abstract plottable which uses keyAxis as its key axis ("x") and valueAxis as its value axis ("y"). | |
| QString | name () const |
| bool | antialiasedFill () const |
| bool | antialiasedScatters () const |
| QPen | pen () const |
| QBrush | brush () const |
| QCPAxis * | keyAxis () const |
| QCPAxis * | valueAxis () const |
| QCP::SelectionType | selectable () const |
| bool | selected () const |
| Returns true if there are any data points of the plottable currently selected. | |
| QCPDataSelection | selection () const |
| Returns a QCPDataSelection encompassing all the data points that are currently selected on this plottable. | |
| QCPSelectionDecorator * | selectionDecorator () const |
| Provides access to the selection decorator of this plottable. | |
| void | setName (const QString &name) |
| The name is the textual representation of this plottable as it is displayed in the legend (QCPLegend). | |
| void | setAntialiasedFill (bool enabled) |
| Sets whether fills of this plottable are drawn antialiased or not. | |
| void | setAntialiasedScatters (bool enabled) |
| Sets whether the scatter symbols of this plottable are drawn antialiased or not. | |
| void | setPen (const QPen &pen) |
| The pen is used to draw basic lines that make up the plottable representation in the plot. | |
| void | setBrush (const QBrush &brush) |
| The brush is used to draw basic fills of the plottable representation in the plot. | |
| void | setKeyAxis (QCPAxis *axis) |
| The key axis of a plottable can be set to any axis of a QCustomPlot, as long as it is orthogonal to the plottable's value axis. | |
| void | setValueAxis (QCPAxis *axis) |
| The value axis of a plottable can be set to any axis of a QCustomPlot, as long as it is orthogonal to the plottable's key axis. | |
| Q_SLOT void | setSelectable (QCP::SelectionType selectable) |
| Sets whether and to which granularity this plottable can be selected. | |
| Q_SLOT void | setSelection (QCPDataSelection selection) |
| Sets which data ranges of this plottable are selected. | |
| void | setSelectionDecorator (QCPSelectionDecorator *decorator) |
| Use this method to set an own QCPSelectionDecorator (subclass) instance. | |
| virtual double | selectTest (const QPointF &pos, bool onlySelectable, QVariant *details=0) const =0 |
| This function is used to decide whether a click hits a layerable object or not. | |
| virtual QCPPlottableInterface1D * | interface1D () |
| If this plottable is a one-dimensional plottable, i.e. | |
| virtual QCPRange | getKeyRange (bool &foundRange, QCP::SignDomain inSignDomain=QCP::sdBoth) const =0 |
| Returns the coordinate range that all data in this plottable span in the key axis dimension. | |
| virtual QCPRange | getValueRange (bool &foundRange, QCP::SignDomain inSignDomain=QCP::sdBoth, const QCPRange &inKeyRange=QCPRange()) const =0 |
| Returns the coordinate range that the data points in the specified key range (inKeyRange) span in the value axis dimension. | |
| void | coordsToPixels (double key, double value, double &x, double &y) const |
| Convenience function for transforming a key/value pair to pixels on the QCustomPlot surface, taking the orientations of the axes associated with this plottable into account (e.g. | |
| const QPointF | coordsToPixels (double key, double value) const |
| This is an overloaded member function, provided for convenience. It differs from the above function only in what argument(s) it accepts.Transforms the given key and value to pixel coordinates and returns them in a QPointF. | |
| void | pixelsToCoords (double x, double y, double &key, double &value) const |
| Convenience function for transforming a x/y pixel pair on the QCustomPlot surface to plot coordinates, taking the orientations of the axes associated with this plottable into account (e.g. | |
| void | pixelsToCoords (const QPointF &pixelPos, double &key, double &value) const |
| This is an overloaded member function, provided for convenience. It differs from the above function only in what argument(s) it accepts.Returns the pixel input pixelPos as plot coordinates key and value. | |
| void | rescaleAxes (bool onlyEnlarge=false) const |
| Rescales the key and value axes associated with this plottable to contain all displayed data, so the whole plottable is visible. | |
| void | rescaleKeyAxis (bool onlyEnlarge=false) const |
| Rescales the key axis of the plottable so the whole plottable is visible. | |
| void | rescaleValueAxis (bool onlyEnlarge=false, bool inKeyRange=false) const |
| Rescales the value axis of the plottable so the whole plottable is visible. | |
| bool | addToLegend (QCPLegend *legend) |
| This is an overloaded member function, provided for convenience. It differs from the above function only in what argument(s) it accepts.Adds this plottable to the specified legend. | |
| bool | addToLegend () |
| This is an overloaded member function, provided for convenience. It differs from the above function only in what argument(s) it accepts.Adds this plottable to the legend of the parent QCustomPlot (QCustomPlot::legend). | |
| bool | removeFromLegend (QCPLegend *legend) const |
| This is an overloaded member function, provided for convenience. It differs from the above function only in what argument(s) it accepts.Removes the plottable from the specifed legend. | |
| bool | removeFromLegend () const |
| This is an overloaded member function, provided for convenience. It differs from the above function only in what argument(s) it accepts.Removes the plottable from the legend of the parent QCustomPlot. | |
| Public Member Functions inherited from QCPLayerable | |
| QCPLayerable (QCustomPlot *plot, QString targetLayer=QString(), QCPLayerable *parentLayerable=0) | |
| Creates a new QCPLayerable instance. | |
| bool | visible () const |
| QCustomPlot * | parentPlot () const |
| QCPLayerable * | parentLayerable () const |
| Returns the parent layerable of this layerable. | |
| QCPLayer * | layer () const |
| bool | antialiased () const |
| void | setVisible (bool on) |
| Sets the visibility of this layerable object. | |
| Q_SLOT bool | setLayer (QCPLayer *layer) |
| Sets the layer of this layerable object. | |
| bool | setLayer (const QString &layerName) |
| This is an overloaded member function, provided for convenience. It differs from the above function only in what argument(s) it accepts. Sets the layer of this layerable object by name. | |
| void | setAntialiased (bool enabled) |
| Sets whether this object will be drawn antialiased or not. | |
| virtual double | selectTest (const QPointF &pos, bool onlySelectable, QVariant *details=0) const |
| This function is used to decide whether a click hits a layerable object or not. | |
| bool | realVisibility () const |
| Returns whether this layerable is visible, taking the visibility of the layerable parent and the visibility of this layerable's layer into account. | |
| virtual int | dataCount () const =0 |
| Returns the number of data points of the plottable. | |
| virtual double | dataMainKey (int index) const =0 |
| Returns the main key of the data point at the given index. | |
| virtual double | dataSortKey (int index) const =0 |
| Returns the sort key of the data point at the given index. | |
| virtual double | dataMainValue (int index) const =0 |
| Returns the main value of the data point at the given index. | |
| virtual QCPRange | dataValueRange (int index) const =0 |
| Returns the value range of the data point at the given index. | |
| virtual QPointF | dataPixelPosition (int index) const =0 |
| Returns the pixel position on the widget surface at which the data point at the given index appears. | |
| virtual bool | sortKeyIsMainKey () const =0 |
| Returns whether the sort key (dataSortKey) is identical to the main key (dataMainKey). | |
| virtual QCPDataSelection | selectTestRect (const QRectF &rect, bool onlySelectable) const =0 |
| Returns a data selection containing all the data points of this plottable which are contained (or hit by) rect. | |
| virtual int | findBegin (double sortKey, bool expandedRange=true) const =0 |
| Returns the index of the data point with a (sort-)key that is equal to, just below, or just above sortKey. | |
| virtual int | findEnd (double sortKey, bool expandedRange=true) const =0 |
| Returns the index one after the data point with a (sort-)key that is equal to, just above, or just below sortKey. | |
Static Public Member Functions | |
| static QCPFinancialDataContainer | timeSeriesToOhlc (const QVector< double > &time, const QVector< double > &value, double timeBinSize, double timeBinOffset=0) |
| A convenience function that converts time series data (value against time) to OHLC binned data points. | |
Protected Member Functions | |
| virtual void | draw (QCPPainter *painter) Q_DECL_OVERRIDE |
| virtual void | drawLegendIcon (QCPPainter *painter, const QRectF &rect) const Q_DECL_OVERRIDE |
| void | drawOhlcPlot (QCPPainter *painter, const QCPFinancialDataContainer::const_iterator &begin, const QCPFinancialDataContainer::const_iterator &end, bool isSelected) |
| void | drawCandlestickPlot (QCPPainter *painter, const QCPFinancialDataContainer::const_iterator &begin, const QCPFinancialDataContainer::const_iterator &end, bool isSelected) |
| double | getPixelWidth (double key, double keyPixel) const |
| double | ohlcSelectTest (const QPointF &pos, const QCPFinancialDataContainer::const_iterator &begin, const QCPFinancialDataContainer::const_iterator &end, QCPFinancialDataContainer::const_iterator &closestDataPoint) const |
| double | candlestickSelectTest (const QPointF &pos, const QCPFinancialDataContainer::const_iterator &begin, const QCPFinancialDataContainer::const_iterator &end, QCPFinancialDataContainer::const_iterator &closestDataPoint) const |
| void | getVisibleDataBounds (QCPFinancialDataContainer::const_iterator &begin, QCPFinancialDataContainer::const_iterator &end) const |
| QRectF | selectionHitBox (QCPFinancialDataContainer::const_iterator it) const |
| Protected Member Functions inherited from QCPAbstractPlottable1D< QCPFinancialData > | |
| void | getDataSegments (QList< QCPDataRange > &selectedSegments, QList< QCPDataRange > &unselectedSegments) const |
| Splits all data into selected and unselected segments and outputs them via selectedSegments and unselectedSegments, respectively. | |
| void | drawPolyline (QCPPainter *painter, const QVector< QPointF > &lineData) const |
| A helper method which draws a line with the passed painter, according to the pixel data in lineData. | |
| Protected Member Functions inherited from QCPAbstractPlottable | |
| virtual QRect | clipRect () const Q_DECL_OVERRIDE |
| virtual void | draw (QCPPainter *painter) Q_DECL_OVERRIDE=0 |
| virtual QCP::Interaction | selectionCategory () const Q_DECL_OVERRIDE |
| void | applyDefaultAntialiasingHint (QCPPainter *painter) const Q_DECL_OVERRIDE |
| virtual void | selectEvent (QMouseEvent *event, bool additive, const QVariant &details, bool *selectionStateChanged) Q_DECL_OVERRIDE |
| virtual void | deselectEvent (bool *selectionStateChanged) Q_DECL_OVERRIDE |
| virtual void | drawLegendIcon (QCPPainter *painter, const QRectF &rect) const =0 |
| void | applyFillAntialiasingHint (QCPPainter *painter) const |
| void | applyScattersAntialiasingHint (QCPPainter *painter) const |
| Protected Member Functions inherited from QCPLayerable | |
| virtual void | parentPlotInitialized (QCustomPlot *parentPlot) |
| virtual QCP::Interaction | selectionCategory () const |
| virtual QRect | clipRect () const |
| virtual void | applyDefaultAntialiasingHint (QCPPainter *painter) const =0 |
| virtual void | draw (QCPPainter *painter)=0 |
| virtual void | selectEvent (QMouseEvent *event, bool additive, const QVariant &details, bool *selectionStateChanged) |
| virtual void | deselectEvent (bool *selectionStateChanged) |
| virtual void | mousePressEvent (QMouseEvent *event, const QVariant &details) |
| This event gets called when the user presses a mouse button while the cursor is over the layerable. | |
| virtual void | mouseMoveEvent (QMouseEvent *event, const QPointF &startPos) |
| This event gets called when the user moves the mouse while holding a mouse button, after this layerable has become the mouse grabber by accepting the preceding mousePressEvent. | |
| virtual void | mouseReleaseEvent (QMouseEvent *event, const QPointF &startPos) |
| This event gets called when the user releases the mouse button, after this layerable has become the mouse grabber by accepting the preceding mousePressEvent. | |
| virtual void | mouseDoubleClickEvent (QMouseEvent *event, const QVariant &details) |
| This event gets called when the user presses the mouse button a second time in a double-click, while the cursor is over the layerable. | |
| virtual void | wheelEvent (QWheelEvent *event) |
| This event gets called when the user turns the mouse scroll wheel while the cursor is over the layerable. | |
| void | initializeParentPlot (QCustomPlot *parentPlot) |
| void | setParentLayerable (QCPLayerable *parentLayerable) |
| bool | moveToLayer (QCPLayer *layer, bool prepend) |
| void | applyAntialiasingHint (QCPPainter *painter, bool localAntialiased, QCP::AntialiasedElement overrideElement) const |
Protected Attributes | |
| ChartStyle | mChartStyle |
| double | mWidth |
| WidthType | mWidthType |
| bool | mTwoColored |
| QBrush | mBrushPositive |
| QBrush | mBrushNegative |
| QPen | mPenPositive |
| QPen | mPenNegative |
| Protected Attributes inherited from QCPAbstractPlottable1D< QCPFinancialData > | |
| QSharedPointer< QCPDataContainer< QCPFinancialData > > | mDataContainer |
| Protected Attributes inherited from QCPAbstractPlottable | |
| QString | mName |
| bool | mAntialiasedFill |
| bool | mAntialiasedScatters |
| QPen | mPen |
| QBrush | mBrush |
| QPointer< QCPAxis > | mKeyAxis |
| QPointer< QCPAxis > | mValueAxis |
| QCP::SelectionType | mSelectable |
| QCPDataSelection | mSelection |
| QCPSelectionDecorator * | mSelectionDecorator |
| Protected Attributes inherited from QCPLayerable | |
| bool | mVisible |
| QCustomPlot * | mParentPlot |
| QPointer< QCPLayerable > | mParentLayerable |
| QCPLayer * | mLayer |
| bool | mAntialiased |
Friends | |
| class | QCustomPlot |
| class | QCPLegend |
Additional Inherited Members | |
| Signals inherited from QCPAbstractPlottable | |
| void | selectionChanged (bool selected) |
| This signal is emitted when the selection state of this plottable has changed, either by user interaction or by a direct call to setSelection. | |
| void | selectionChanged (const QCPDataSelection &selection) |
| This signal is emitted when the selection state of this plottable has changed, either by user interaction or by a direct call to setSelection. | |
| void | selectableChanged (QCP::SelectionType selectable) |
| This signal is emitted when the selectability of this plottable has changed. | |
| Signals inherited from QCPLayerable | |
| void | layerChanged (QCPLayer *newLayer) |
| This signal is emitted when the layer of this layerable changes, i.e. | |
Detailed Description
A plottable representing a financial stock chart.

This plottable represents time series data binned to certain intervals, mainly used for stock charts. The two common representations OHLC (Open-High-Low-Close) bars and Candlesticks can be set via setChartStyle.
The data is passed via setData as a set of open/high/low/close values at certain keys (typically times). This means the data must be already binned appropriately. If data is only available as a series of values (e.g. price against time), you can use the static convenience function timeSeriesToOhlc to generate binned OHLC-data which can then be passed to setData.
The width of the OHLC bars/candlesticks can be controlled with setWidth and setWidthType. A typical choice is to set the width type to wtPlotCoords (the default) and the width to (or slightly less than) one time bin interval width.
Changing the appearance
Charts can be either single- or two-colored (setTwoColored). If set to be single-colored, lines are drawn with the plottable's pen (setPen) and fills with the brush (setBrush).
If set to two-colored, positive changes of the value during an interval (close >= open) are represented with a different pen and brush than negative changes (close < open). These can be configured with setPenPositive, setPenNegative, setBrushPositive, and setBrushNegative. In two-colored mode, the normal plottable pen/brush is ignored. Upon selection however, the normal selected pen/brush (provided by the selectionDecorator) is used, irrespective of whether the chart is single- or two-colored.
Usage
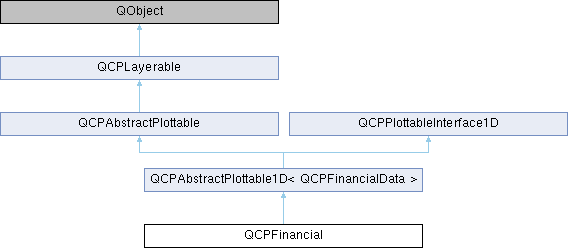
Like all data representing objects in QCustomPlot, the QCPFinancial is a plottable (QCPAbstractPlottable). So the plottable-interface of QCustomPlot applies (QCustomPlot::plottable, QCustomPlot::removePlottable, etc.)
Usually, you first create an instance:
which registers it with the QCustomPlot instance of the passed axes. Note that this QCustomPlot instance takes ownership of the plottable, so do not delete it manually but use QCustomPlot::removePlottable() instead. The newly created plottable can be modified, e.g.:
Here we have used the static helper method timeSeriesToOhlc, to turn a time-price data series into a 24-hour binned open-high-low-close data series as QCPFinancial uses.
Member Enumeration Documentation
◆ ChartStyle
Defines the possible representations of OHLC data in the plot.
- See also
- setChartStyle
| Enumerator | |
|---|---|
| csOhlc | Open-High-Low-Close bar representation. |
| csCandlestick | Candlestick representation. |
◆ WidthType
Defines the ways the width of the financial bar can be specified.
Thus it defines what the number passed to setWidth actually means.
- See also
- setWidthType, setWidth
| Enumerator | |
|---|---|
| wtAbsolute | width is in absolute pixels |
| wtAxisRectRatio | width is given by a fraction of the axis rect size |
| wtPlotCoords | width is in key coordinates and thus scales with the key axis range |
Constructor & Destructor Documentation
◆ QCPFinancial()
Constructs a financial chart which uses keyAxis as its key axis ("x") and valueAxis as its value axis ("y").
keyAxis and valueAxis must reside in the same QCustomPlot instance and not have the same orientation. If either of these restrictions is violated, a corresponding message is printed to the debug output (qDebug), the construction is not aborted, though.
The created QCPFinancial is automatically registered with the QCustomPlot instance inferred from keyAxis. This QCustomPlot instance takes ownership of the QCPFinancial, so do not delete it manually but use QCustomPlot::removePlottable() instead.
Member Function Documentation
◆ addData() [1/2]
| void QCPFinancial::addData | ( | const QVector< double > & | keys, |
| const QVector< double > & | open, | ||
| const QVector< double > & | high, | ||
| const QVector< double > & | low, | ||
| const QVector< double > & | close, | ||
| bool | alreadySorted = false |
||
| ) |
This is an overloaded member function, provided for convenience. It differs from the above function only in what argument(s) it accepts.Adds the provided points in keys, open, high, low and close to the current data.
The provided vectors should have equal length. Else, the number of added points will be the size of the smallest vector.
If you can guarantee that the passed data points are sorted by keys in ascending order, you can set alreadySorted to true, to improve performance by saving a sorting run.
Alternatively, you can also access and modify the data directly via the data method, which returns a pointer to the internal data container.
- See also
- timeSeriesToOhlc
◆ addData() [2/2]
| void QCPFinancial::addData | ( | double | key, |
| double | open, | ||
| double | high, | ||
| double | low, | ||
| double | close | ||
| ) |
This is an overloaded member function, provided for convenience. It differs from the above function only in what argument(s) it accepts.Adds the provided data point as key, open, high, low and close to the current data.
Alternatively, you can also access and modify the data directly via the data method, which returns a pointer to the internal data container.
- See also
- timeSeriesToOhlc
◆ data()
|
inline |
◆ draw()
|
protectedvirtual |
Implements QCPAbstractPlottable.
◆ drawLegendIcon()
|
protectedvirtual |
Implements QCPAbstractPlottable.
◆ getKeyRange()
|
virtual |
Returns the coordinate range that all data in this plottable span in the key axis dimension.
For logarithmic plots, one can set inSignDomain to either QCP::sdNegative or QCP::sdPositive in order to restrict the returned range to that sign domain. E.g. when only negative range is wanted, set inSignDomain to QCP::sdNegative and all positive points will be ignored for range calculation. For no restriction, just set inSignDomain to QCP::sdBoth (default). foundRange is an output parameter that indicates whether a range could be found or not. If this is false, you shouldn't use the returned range (e.g. no points in data).
Note that foundRange is not the same as QCPRange::validRange, since the range returned by this function may have size zero (e.g. when there is only one data point). In this case foundRange would return true, but the returned range is not a valid range in terms of QCPRange::validRange.
- See also
- rescaleAxes, getValueRange
Implements QCPAbstractPlottable.
◆ getValueRange()
|
virtual |
Returns the coordinate range that the data points in the specified key range (inKeyRange) span in the value axis dimension.
For logarithmic plots, one can set inSignDomain to either QCP::sdNegative or QCP::sdPositive in order to restrict the returned range to that sign domain. E.g. when only negative range is wanted, set inSignDomain to QCP::sdNegative and all positive points will be ignored for range calculation. For no restriction, just set inSignDomain to QCP::sdBoth (default). foundRange is an output parameter that indicates whether a range could be found or not. If this is false, you shouldn't use the returned range (e.g. no points in data).
If inKeyRange has both lower and upper bound set to zero (is equal to QCPRange()), all data points are considered, without any restriction on the keys.
Note that foundRange is not the same as QCPRange::validRange, since the range returned by this function may have size zero (e.g. when there is only one data point). In this case foundRange would return true, but the returned range is not a valid range in terms of QCPRange::validRange.
- See also
- rescaleAxes, getKeyRange
Implements QCPAbstractPlottable.
◆ selectTest()
|
virtual |
Implements a point-selection algorithm assuming the data (accessed via the 1D data interface) is point-like.
Most subclasses will want to reimplement this method again, to provide a more accurate hit test based on the true data visualization geometry.
\seebaseclassmethod
Reimplemented from QCPAbstractPlottable1D< QCPFinancialData >.
◆ selectTestRect()
|
virtual |
Returns a data selection containing all the data points of this plottable which are contained (or hit by) rect.
This is used mainly in the selection rect interaction for data selection (data selection mechanism).
If onlySelectable is true, an empty QCPDataSelection is returned if this plottable is not selectable (i.e. if QCPAbstractPlottable::setSelectable is QCP::stNone).
- Note
- rect must be a normalized rect (positive or zero width and height). This is especially important when using the rect of QCPSelectionRect::accepted, which is not necessarily normalized. Use
QRect::normalized()when passing a rect which might not be normalized.
Reimplemented from QCPAbstractPlottable1D< QCPFinancialData >.
◆ setBrushNegative()
| void QCPFinancial::setBrushNegative | ( | const QBrush & | brush | ) |
If setTwoColored is set to true, this function controls the brush that is used to draw fills of data points with a negative trend (i.e.
bars/candlesticks with close < open).
If twoColored is false, the normal plottable's pen and brush are used (setPen, setBrush).
- See also
- setBrushPositive, setPenNegative, setPenPositive
◆ setBrushPositive()
| void QCPFinancial::setBrushPositive | ( | const QBrush & | brush | ) |
If setTwoColored is set to true, this function controls the brush that is used to draw fills of data points with a positive trend (i.e.
bars/candlesticks with close >= open).
If twoColored is false, the normal plottable's pen and brush are used (setPen, setBrush).
- See also
- setBrushNegative, setPenPositive, setPenNegative
◆ setData() [1/2]
| void QCPFinancial::setData | ( | const QVector< double > & | keys, |
| const QVector< double > & | open, | ||
| const QVector< double > & | high, | ||
| const QVector< double > & | low, | ||
| const QVector< double > & | close, | ||
| bool | alreadySorted = false |
||
| ) |
This is an overloaded member function, provided for convenience. It differs from the above function only in what argument(s) it accepts.Replaces the current data with the provided points in keys, open, high, low and close.
The provided vectors should have equal length. Else, the number of added points will be the size of the smallest vector.
If you can guarantee that the passed data points are sorted by keys in ascending order, you can set alreadySorted to true, to improve performance by saving a sorting run.
- See also
- addData, timeSeriesToOhlc
◆ setData() [2/2]
| void QCPFinancial::setData | ( | QSharedPointer< QCPFinancialDataContainer > | data | ) |
This is an overloaded member function, provided for convenience. It differs from the above function only in what argument(s) it accepts.Replaces the current data container with the provided data container.
Since a QSharedPointer is used, multiple QCPFinancials may share the same data container safely. Modifying the data in the container will then affect all financials that share the container. Sharing can be achieved by simply exchanging the data containers wrapped in shared pointers:
If you do not wish to share containers, but create a copy from an existing container, rather use the QCPDataContainer<DataType>::set method on the financial's data container directly:
- See also
- addData, timeSeriesToOhlc
◆ setPenNegative()
| void QCPFinancial::setPenNegative | ( | const QPen & | pen | ) |
If setTwoColored is set to true, this function controls the pen that is used to draw outlines of data points with a negative trend (i.e.
bars/candlesticks with close < open).
If twoColored is false, the normal plottable's pen and brush are used (setPen, setBrush).
- See also
- setPenPositive, setBrushNegative, setBrushPositive
◆ setPenPositive()
| void QCPFinancial::setPenPositive | ( | const QPen & | pen | ) |
If setTwoColored is set to true, this function controls the pen that is used to draw outlines of data points with a positive trend (i.e.
bars/candlesticks with close >= open).
If twoColored is false, the normal plottable's pen and brush are used (setPen, setBrush).
- See also
- setPenNegative, setBrushPositive, setBrushNegative
◆ setTwoColored()
| void QCPFinancial::setTwoColored | ( | bool | twoColored | ) |
◆ setWidth()
| void QCPFinancial::setWidth | ( | double | width | ) |
Sets the width of the individual bars/candlesticks to width in plot key coordinates.
A typical choice is to set it to (or slightly less than) one bin interval width.
◆ setWidthType()
| void QCPFinancial::setWidthType | ( | QCPFinancial::WidthType | widthType | ) |
Sets how the width of the financial bars is defined.
See the documentation of WidthType for an explanation of the possible values for widthType.
The default value is wtPlotCoords.
- See also
- setWidth
◆ timeSeriesToOhlc()
|
static |
A convenience function that converts time series data (value against time) to OHLC binned data points.
The return value can then be passed on to QCPFinancialDataContainer::set(const QCPFinancialDataContainer&).
The size of the bins can be controlled with timeBinSize in the same units as time is given. For example, if the unit of time is seconds and single OHLC/Candlesticks should span an hour each, set timeBinSize to 3600.
timeBinOffset allows to control precisely at what time coordinate a bin should start. The value passed as timeBinOffset doesn't need to be in the range encompassed by the time keys. It merely defines the mathematical offset/phase of the bins that will be used to process the data.
The documentation for this class was generated from the following files:
- qcustomplot.h
- qcustomplot.cpp