A plottable that adds a set of error bars to other plottables. More...
Public Types | |
| enum | ErrorType { etKeyError , etValueError } |
| Defines in which orientation the error bars shall appear. More... | |
Public Member Functions | |
| QCPErrorBars (QCPAxis *keyAxis, QCPAxis *valueAxis) | |
| Constructs an error bars plottable which uses keyAxis as its key axis ("x") and valueAxis as its value axis ("y"). | |
| QSharedPointer< QCPErrorBarsDataContainer > | data () const |
| Returns a shared pointer to the internal data storage of type QCPErrorBarsDataContainer. | |
| QCPAbstractPlottable * | dataPlottable () const |
| ErrorType | errorType () const |
| double | whiskerWidth () const |
| double | symbolGap () const |
| void | setData (QSharedPointer< QCPErrorBarsDataContainer > data) |
| This is an overloaded member function, provided for convenience. It differs from the above function only in what argument(s) it accepts.Replaces the current data container with the provided data container. | |
| void | setData (const QVector< double > &error) |
| This is an overloaded member function, provided for convenience. It differs from the above function only in what argument(s) it accepts.Sets symmetrical error values as specified in error. | |
| void | setData (const QVector< double > &errorMinus, const QVector< double > &errorPlus) |
| This is an overloaded member function, provided for convenience. It differs from the above function only in what argument(s) it accepts.Sets asymmetrical errors as specified in errorMinus and errorPlus. | |
| void | setDataPlottable (QCPAbstractPlottable *plottable) |
| Sets the data plottable to which the error bars will be applied. | |
| void | setErrorType (ErrorType type) |
| Sets in which orientation the error bars shall appear on the data points. | |
| void | setWhiskerWidth (double pixels) |
| Sets the width of the whiskers (the short bars at the end of the actual error bar backbones) to pixels. | |
| void | setSymbolGap (double pixels) |
| Sets the gap diameter around the data points that will be left out when drawing the error bar backbones. | |
| void | addData (const QVector< double > &error) |
| This is an overloaded member function, provided for convenience. It differs from the above function only in what argument(s) it accepts.Adds symmetrical error values as specified in error. | |
| void | addData (const QVector< double > &errorMinus, const QVector< double > &errorPlus) |
| This is an overloaded member function, provided for convenience. It differs from the above function only in what argument(s) it accepts.Adds asymmetrical errors as specified in errorMinus and errorPlus. | |
| void | addData (double error) |
| This is an overloaded member function, provided for convenience. It differs from the above function only in what argument(s) it accepts.Adds a single symmetrical error bar as specified in error. | |
| void | addData (double errorMinus, double errorPlus) |
| This is an overloaded member function, provided for convenience. It differs from the above function only in what argument(s) it accepts.Adds a single asymmetrical error bar as specified in errorMinus and errorPlus. | |
| virtual int | dataCount () const Q_DECL_OVERRIDE |
| Returns the number of data points of the plottable. | |
| virtual double | dataMainKey (int index) const Q_DECL_OVERRIDE |
| Returns the main key of the data point at the given index. | |
| virtual double | dataSortKey (int index) const Q_DECL_OVERRIDE |
| Returns the sort key of the data point at the given index. | |
| virtual double | dataMainValue (int index) const Q_DECL_OVERRIDE |
| Returns the main value of the data point at the given index. | |
| virtual QCPRange | dataValueRange (int index) const Q_DECL_OVERRIDE |
| Returns the value range of the data point at the given index. | |
| virtual QPointF | dataPixelPosition (int index) const Q_DECL_OVERRIDE |
| Returns the pixel position on the widget surface at which the data point at the given index appears. | |
| virtual bool | sortKeyIsMainKey () const Q_DECL_OVERRIDE |
| Returns whether the sort key (dataSortKey) is identical to the main key (dataMainKey). | |
| virtual QCPDataSelection | selectTestRect (const QRectF &rect, bool onlySelectable) const Q_DECL_OVERRIDE |
| Returns a data selection containing all the data points of this plottable which are contained (or hit by) rect. | |
| virtual int | findBegin (double sortKey, bool expandedRange=true) const Q_DECL_OVERRIDE |
| Returns the index of the data point with a (sort-)key that is equal to, just below, or just above sortKey. | |
| virtual int | findEnd (double sortKey, bool expandedRange=true) const Q_DECL_OVERRIDE |
| Returns the index one after the data point with a (sort-)key that is equal to, just above, or just below sortKey. | |
| virtual double | selectTest (const QPointF &pos, bool onlySelectable, QVariant *details=0) const Q_DECL_OVERRIDE |
| This function is used to decide whether a click hits a layerable object or not. | |
| virtual QCPPlottableInterface1D * | interface1D () Q_DECL_OVERRIDE |
| If this plottable is a one-dimensional plottable, i.e. | |
 Public Member Functions inherited from QCPAbstractPlottable Public Member Functions inherited from QCPAbstractPlottable | |
| QCPAbstractPlottable (QCPAxis *keyAxis, QCPAxis *valueAxis) | |
| Constructs an abstract plottable which uses keyAxis as its key axis ("x") and valueAxis as its value axis ("y"). | |
| QString | name () const |
| bool | antialiasedFill () const |
| bool | antialiasedScatters () const |
| QPen | pen () const |
| QBrush | brush () const |
| QCPAxis * | keyAxis () const |
| QCPAxis * | valueAxis () const |
| QCP::SelectionType | selectable () const |
| bool | selected () const |
| Returns true if there are any data points of the plottable currently selected. | |
| QCPDataSelection | selection () const |
| Returns a QCPDataSelection encompassing all the data points that are currently selected on this plottable. | |
| QCPSelectionDecorator * | selectionDecorator () const |
| Provides access to the selection decorator of this plottable. | |
| void | setName (const QString &name) |
| The name is the textual representation of this plottable as it is displayed in the legend (QCPLegend). | |
| void | setAntialiasedFill (bool enabled) |
| Sets whether fills of this plottable are drawn antialiased or not. | |
| void | setAntialiasedScatters (bool enabled) |
| Sets whether the scatter symbols of this plottable are drawn antialiased or not. | |
| void | setPen (const QPen &pen) |
| The pen is used to draw basic lines that make up the plottable representation in the plot. | |
| void | setBrush (const QBrush &brush) |
| The brush is used to draw basic fills of the plottable representation in the plot. | |
| void | setKeyAxis (QCPAxis *axis) |
| The key axis of a plottable can be set to any axis of a QCustomPlot, as long as it is orthogonal to the plottable's value axis. | |
| void | setValueAxis (QCPAxis *axis) |
| The value axis of a plottable can be set to any axis of a QCustomPlot, as long as it is orthogonal to the plottable's key axis. | |
| Q_SLOT void | setSelectable (QCP::SelectionType selectable) |
| Sets whether and to which granularity this plottable can be selected. | |
| Q_SLOT void | setSelection (QCPDataSelection selection) |
| Sets which data ranges of this plottable are selected. | |
| void | setSelectionDecorator (QCPSelectionDecorator *decorator) |
| Use this method to set an own QCPSelectionDecorator (subclass) instance. | |
| virtual double | selectTest (const QPointF &pos, bool onlySelectable, QVariant *details=0) const =0 |
| This function is used to decide whether a click hits a layerable object or not. | |
| virtual QCPPlottableInterface1D * | interface1D () |
| If this plottable is a one-dimensional plottable, i.e. | |
| virtual QCPRange | getKeyRange (bool &foundRange, QCP::SignDomain inSignDomain=QCP::sdBoth) const =0 |
| Returns the coordinate range that all data in this plottable span in the key axis dimension. | |
| virtual QCPRange | getValueRange (bool &foundRange, QCP::SignDomain inSignDomain=QCP::sdBoth, const QCPRange &inKeyRange=QCPRange()) const =0 |
| Returns the coordinate range that the data points in the specified key range (inKeyRange) span in the value axis dimension. | |
| void | coordsToPixels (double key, double value, double &x, double &y) const |
| Convenience function for transforming a key/value pair to pixels on the QCustomPlot surface, taking the orientations of the axes associated with this plottable into account (e.g. | |
| const QPointF | coordsToPixels (double key, double value) const |
| This is an overloaded member function, provided for convenience. It differs from the above function only in what argument(s) it accepts.Transforms the given key and value to pixel coordinates and returns them in a QPointF. | |
| void | pixelsToCoords (double x, double y, double &key, double &value) const |
| Convenience function for transforming a x/y pixel pair on the QCustomPlot surface to plot coordinates, taking the orientations of the axes associated with this plottable into account (e.g. | |
| void | pixelsToCoords (const QPointF &pixelPos, double &key, double &value) const |
| This is an overloaded member function, provided for convenience. It differs from the above function only in what argument(s) it accepts.Returns the pixel input pixelPos as plot coordinates key and value. | |
| void | rescaleAxes (bool onlyEnlarge=false) const |
| Rescales the key and value axes associated with this plottable to contain all displayed data, so the whole plottable is visible. | |
| void | rescaleKeyAxis (bool onlyEnlarge=false) const |
| Rescales the key axis of the plottable so the whole plottable is visible. | |
| void | rescaleValueAxis (bool onlyEnlarge=false, bool inKeyRange=false) const |
| Rescales the value axis of the plottable so the whole plottable is visible. | |
| bool | addToLegend (QCPLegend *legend) |
| This is an overloaded member function, provided for convenience. It differs from the above function only in what argument(s) it accepts.Adds this plottable to the specified legend. | |
| bool | addToLegend () |
| This is an overloaded member function, provided for convenience. It differs from the above function only in what argument(s) it accepts.Adds this plottable to the legend of the parent QCustomPlot (QCustomPlot::legend). | |
| bool | removeFromLegend (QCPLegend *legend) const |
| This is an overloaded member function, provided for convenience. It differs from the above function only in what argument(s) it accepts.Removes the plottable from the specifed legend. | |
| bool | removeFromLegend () const |
| This is an overloaded member function, provided for convenience. It differs from the above function only in what argument(s) it accepts.Removes the plottable from the legend of the parent QCustomPlot. | |
| Public Member Functions inherited from QCPLayerable | |
| QCPLayerable (QCustomPlot *plot, QString targetLayer=QString(), QCPLayerable *parentLayerable=0) | |
| Creates a new QCPLayerable instance. | |
| bool | visible () const |
| QCustomPlot * | parentPlot () const |
| QCPLayerable * | parentLayerable () const |
| Returns the parent layerable of this layerable. | |
| QCPLayer * | layer () const |
| bool | antialiased () const |
| void | setVisible (bool on) |
| Sets the visibility of this layerable object. | |
| Q_SLOT bool | setLayer (QCPLayer *layer) |
| Sets the layer of this layerable object. | |
| bool | setLayer (const QString &layerName) |
| This is an overloaded member function, provided for convenience. It differs from the above function only in what argument(s) it accepts. Sets the layer of this layerable object by name. | |
| void | setAntialiased (bool enabled) |
| Sets whether this object will be drawn antialiased or not. | |
| virtual double | selectTest (const QPointF &pos, bool onlySelectable, QVariant *details=0) const |
| This function is used to decide whether a click hits a layerable object or not. | |
| bool | realVisibility () const |
| Returns whether this layerable is visible, taking the visibility of the layerable parent and the visibility of this layerable's layer into account. | |
| virtual int | dataCount () const =0 |
| Returns the number of data points of the plottable. | |
| virtual double | dataMainKey (int index) const =0 |
| Returns the main key of the data point at the given index. | |
| virtual double | dataSortKey (int index) const =0 |
| Returns the sort key of the data point at the given index. | |
| virtual double | dataMainValue (int index) const =0 |
| Returns the main value of the data point at the given index. | |
| virtual QCPRange | dataValueRange (int index) const =0 |
| Returns the value range of the data point at the given index. | |
| virtual QPointF | dataPixelPosition (int index) const =0 |
| Returns the pixel position on the widget surface at which the data point at the given index appears. | |
| virtual bool | sortKeyIsMainKey () const =0 |
| Returns whether the sort key (dataSortKey) is identical to the main key (dataMainKey). | |
| virtual QCPDataSelection | selectTestRect (const QRectF &rect, bool onlySelectable) const =0 |
| Returns a data selection containing all the data points of this plottable which are contained (or hit by) rect. | |
| virtual int | findBegin (double sortKey, bool expandedRange=true) const =0 |
| Returns the index of the data point with a (sort-)key that is equal to, just below, or just above sortKey. | |
| virtual int | findEnd (double sortKey, bool expandedRange=true) const =0 |
| Returns the index one after the data point with a (sort-)key that is equal to, just above, or just below sortKey. | |
Protected Member Functions | |
| virtual void | draw (QCPPainter *painter) Q_DECL_OVERRIDE |
| virtual void | drawLegendIcon (QCPPainter *painter, const QRectF &rect) const Q_DECL_OVERRIDE |
| virtual QCPRange | getKeyRange (bool &foundRange, QCP::SignDomain inSignDomain=QCP::sdBoth) const Q_DECL_OVERRIDE |
| Returns the coordinate range that all data in this plottable span in the key axis dimension. | |
| virtual QCPRange | getValueRange (bool &foundRange, QCP::SignDomain inSignDomain=QCP::sdBoth, const QCPRange &inKeyRange=QCPRange()) const Q_DECL_OVERRIDE |
| Returns the coordinate range that the data points in the specified key range (inKeyRange) span in the value axis dimension. | |
| void | getErrorBarLines (QCPErrorBarsDataContainer::const_iterator it, QVector< QLineF > &backbones, QVector< QLineF > &whiskers) const |
| void | getVisibleDataBounds (QCPErrorBarsDataContainer::const_iterator &begin, QCPErrorBarsDataContainer::const_iterator &end, const QCPDataRange &rangeRestriction) const |
| double | pointDistance (const QPointF &pixelPoint, QCPErrorBarsDataContainer::const_iterator &closestData) const |
| void | getDataSegments (QList< QCPDataRange > &selectedSegments, QList< QCPDataRange > &unselectedSegments) const |
| bool | errorBarVisible (int index) const |
| bool | rectIntersectsLine (const QRectF &pixelRect, const QLineF &line) const |
| Protected Member Functions inherited from QCPAbstractPlottable | |
| virtual QRect | clipRect () const Q_DECL_OVERRIDE |
| virtual void | draw (QCPPainter *painter) Q_DECL_OVERRIDE=0 |
| virtual QCP::Interaction | selectionCategory () const Q_DECL_OVERRIDE |
| void | applyDefaultAntialiasingHint (QCPPainter *painter) const Q_DECL_OVERRIDE |
| virtual void | selectEvent (QMouseEvent *event, bool additive, const QVariant &details, bool *selectionStateChanged) Q_DECL_OVERRIDE |
| virtual void | deselectEvent (bool *selectionStateChanged) Q_DECL_OVERRIDE |
| virtual void | drawLegendIcon (QCPPainter *painter, const QRectF &rect) const =0 |
| void | applyFillAntialiasingHint (QCPPainter *painter) const |
| void | applyScattersAntialiasingHint (QCPPainter *painter) const |
| Protected Member Functions inherited from QCPLayerable | |
| virtual void | parentPlotInitialized (QCustomPlot *parentPlot) |
| virtual QCP::Interaction | selectionCategory () const |
| virtual QRect | clipRect () const |
| virtual void | applyDefaultAntialiasingHint (QCPPainter *painter) const =0 |
| virtual void | draw (QCPPainter *painter)=0 |
| virtual void | selectEvent (QMouseEvent *event, bool additive, const QVariant &details, bool *selectionStateChanged) |
| virtual void | deselectEvent (bool *selectionStateChanged) |
| virtual void | mousePressEvent (QMouseEvent *event, const QVariant &details) |
| This event gets called when the user presses a mouse button while the cursor is over the layerable. | |
| virtual void | mouseMoveEvent (QMouseEvent *event, const QPointF &startPos) |
| This event gets called when the user moves the mouse while holding a mouse button, after this layerable has become the mouse grabber by accepting the preceding mousePressEvent. | |
| virtual void | mouseReleaseEvent (QMouseEvent *event, const QPointF &startPos) |
| This event gets called when the user releases the mouse button, after this layerable has become the mouse grabber by accepting the preceding mousePressEvent. | |
| virtual void | mouseDoubleClickEvent (QMouseEvent *event, const QVariant &details) |
| This event gets called when the user presses the mouse button a second time in a double-click, while the cursor is over the layerable. | |
| virtual void | wheelEvent (QWheelEvent *event) |
| This event gets called when the user turns the mouse scroll wheel while the cursor is over the layerable. | |
| void | initializeParentPlot (QCustomPlot *parentPlot) |
| void | setParentLayerable (QCPLayerable *parentLayerable) |
| bool | moveToLayer (QCPLayer *layer, bool prepend) |
| void | applyAntialiasingHint (QCPPainter *painter, bool localAntialiased, QCP::AntialiasedElement overrideElement) const |
Protected Attributes | |
| QSharedPointer< QCPErrorBarsDataContainer > | mDataContainer |
| QPointer< QCPAbstractPlottable > | mDataPlottable |
| ErrorType | mErrorType |
| double | mWhiskerWidth |
| double | mSymbolGap |
| Protected Attributes inherited from QCPAbstractPlottable | |
| QString | mName |
| bool | mAntialiasedFill |
| bool | mAntialiasedScatters |
| QPen | mPen |
| QBrush | mBrush |
| QPointer< QCPAxis > | mKeyAxis |
| QPointer< QCPAxis > | mValueAxis |
| QCP::SelectionType | mSelectable |
| QCPDataSelection | mSelection |
| QCPSelectionDecorator * | mSelectionDecorator |
| Protected Attributes inherited from QCPLayerable | |
| bool | mVisible |
| QCustomPlot * | mParentPlot |
| QPointer< QCPLayerable > | mParentLayerable |
| QCPLayer * | mLayer |
| bool | mAntialiased |
Friends | |
| class | QCustomPlot |
| class | QCPLegend |
Additional Inherited Members | |
| Signals inherited from QCPAbstractPlottable | |
| void | selectionChanged (bool selected) |
| This signal is emitted when the selection state of this plottable has changed, either by user interaction or by a direct call to setSelection. | |
| void | selectionChanged (const QCPDataSelection &selection) |
| This signal is emitted when the selection state of this plottable has changed, either by user interaction or by a direct call to setSelection. | |
| void | selectableChanged (QCP::SelectionType selectable) |
| This signal is emitted when the selectability of this plottable has changed. | |
| Signals inherited from QCPLayerable | |
| void | layerChanged (QCPLayer *newLayer) |
| This signal is emitted when the layer of this layerable changes, i.e. | |
Detailed Description
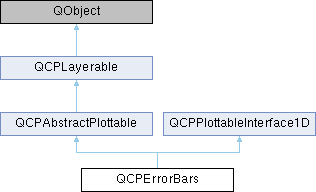
A plottable that adds a set of error bars to other plottables.

The QCPErrorBars plottable can be attached to other one-dimensional plottables (e.g. QCPGraph, QCPCurve, QCPBars, etc.) and equips them with error bars.
Use setDataPlottable to define for which plottable the QCPErrorBars shall display the error bars. The orientation of the error bars can be controlled with setErrorType.
By using setData, you can supply the actual error data, either as symmetric error or plus/minus asymmetric errors. QCPErrorBars only stores the error data. The absolute key/value position of each error bar will be adopted from the configured data plottable. The error data of the QCPErrorBars are associated one-to-one via their index to the data points of the data plottable. You can directly access and manipulate the error bar data via data.
Set either of the plus/minus errors to NaN (qQNaN() or std::numeric_limits<double>::quiet_NaN()) to not show the respective error bar on the data point at that index.
Changing the appearance
The appearance of the error bars is defined by the pen (setPen), and the width of the whiskers (setWhiskerWidth). Further, the error bar backbones may leave a gap around the data point center to prevent that error bars are drawn too close to or even through scatter points. This gap size can be controlled via setSymbolGap.
Member Enumeration Documentation
◆ ErrorType
Defines in which orientation the error bars shall appear.
If your data needs both error dimensions, create two QCPErrorBars with different ErrorType.
- See also
- setErrorType
| Enumerator | |
|---|---|
| etKeyError | The errors are for the key dimension (bars appear parallel to the key axis) |
| etValueError | The errors are for the value dimension (bars appear parallel to the value axis) |
Constructor & Destructor Documentation
◆ QCPErrorBars()
Constructs an error bars plottable which uses keyAxis as its key axis ("x") and valueAxis as its value axis ("y").
keyAxis and valueAxis must reside in the same QCustomPlot instance and not have the same orientation. If either of these restrictions is violated, a corresponding message is printed to the debug output (qDebug), the construction is not aborted, though.
It is also important that the keyAxis and valueAxis are the same for the error bars plottable and the data plottable that the error bars shall be drawn on (setDataPlottable).
The created QCPErrorBars is automatically registered with the QCustomPlot instance inferred from keyAxis. This QCustomPlot instance takes ownership of the QCPErrorBars, so do not delete it manually but use QCustomPlot::removePlottable() instead.
Member Function Documentation
◆ addData() [1/4]
| void QCPErrorBars::addData | ( | const QVector< double > & | error | ) |
This is an overloaded member function, provided for convenience. It differs from the above function only in what argument(s) it accepts.Adds symmetrical error values as specified in error.
The errors will be associated one-to-one by the data point index to the associated data plottable (setDataPlottable).
You can directly access and manipulate the error bar data via data.
- See also
- setData
◆ addData() [2/4]
| void QCPErrorBars::addData | ( | const QVector< double > & | errorMinus, |
| const QVector< double > & | errorPlus | ||
| ) |
This is an overloaded member function, provided for convenience. It differs from the above function only in what argument(s) it accepts.Adds asymmetrical errors as specified in errorMinus and errorPlus.
The errors will be associated one-to-one by the data point index to the associated data plottable (setDataPlottable).
You can directly access and manipulate the error bar data via data.
- See also
- setData
◆ addData() [3/4]
| void QCPErrorBars::addData | ( | double | error | ) |
This is an overloaded member function, provided for convenience. It differs from the above function only in what argument(s) it accepts.Adds a single symmetrical error bar as specified in error.
The errors will be associated one-to-one by the data point index to the associated data plottable (setDataPlottable).
You can directly access and manipulate the error bar data via data.
- See also
- setData
◆ addData() [4/4]
| void QCPErrorBars::addData | ( | double | errorMinus, |
| double | errorPlus | ||
| ) |
This is an overloaded member function, provided for convenience. It differs from the above function only in what argument(s) it accepts.Adds a single asymmetrical error bar as specified in errorMinus and errorPlus.
The errors will be associated one-to-one by the data point index to the associated data plottable (setDataPlottable).
You can directly access and manipulate the error bar data via data.
- See also
- setData
◆ data()
|
inline |
Returns a shared pointer to the internal data storage of type QCPErrorBarsDataContainer.
You may use it to directly manipulate the error values, which may be more convenient and faster than using the regular setData methods.
◆ dataCount()
|
virtual |
Returns the number of data points of the plottable.
Implements QCPPlottableInterface1D.
◆ dataMainKey()
|
virtual |
Returns the main key of the data point at the given index.
What the main key is, is defined by the plottable's data type. See the QCPDataContainer DataType documentation for details about this naming convention.
Implements QCPPlottableInterface1D.
◆ dataMainValue()
|
virtual |
Returns the main value of the data point at the given index.
What the main value is, is defined by the plottable's data type. See the QCPDataContainer DataType documentation for details about this naming convention.
Implements QCPPlottableInterface1D.
◆ dataPixelPosition()
|
virtual |
Returns the pixel position on the widget surface at which the data point at the given index appears.
Usually this corresponds to the point of dataMainKey/ dataMainValue, in pixel coordinates. However, depending on the plottable, this might be a different apparent position than just a coord-to-pixel transform of those values. For example, QCPBars apparent data values can be shifted depending on their stacking, bar grouping or configured base value.
Implements QCPPlottableInterface1D.
◆ dataSortKey()
|
virtual |
Returns the sort key of the data point at the given index.
What the sort key is, is defined by the plottable's data type. See the QCPDataContainer DataType documentation for details about this naming convention.
Implements QCPPlottableInterface1D.
◆ dataValueRange()
|
virtual |
Returns the value range of the data point at the given index.
What the value range is, is defined by the plottable's data type. See the QCPDataContainer DataType documentation for details about this naming convention.
Implements QCPPlottableInterface1D.
◆ draw()
|
protectedvirtual |
Implements QCPAbstractPlottable.
◆ drawLegendIcon()
|
protectedvirtual |
Implements QCPAbstractPlottable.
◆ findBegin()
|
virtual |
Returns the index of the data point with a (sort-)key that is equal to, just below, or just above sortKey.
If expandedRange is true, the data point just below sortKey will be considered, otherwise the one just above.
This can be used in conjunction with findEnd to iterate over data points within a given key range, including or excluding the bounding data points that are just beyond the specified range.
If expandedRange is true but there are no data points below sortKey, 0 is returned.
If the container is empty, returns 0 (in that case, findEnd will also return 0, so a loop using these methods will not iterate over the index 0).
- See also
- findEnd, QCPDataContainer::findBegin
Implements QCPPlottableInterface1D.
◆ findEnd()
|
virtual |
Returns the index one after the data point with a (sort-)key that is equal to, just above, or just below sortKey.
If expandedRange is true, the data point just above sortKey will be considered, otherwise the one just below.
This can be used in conjunction with findBegin to iterate over data points within a given key range, including the bounding data points that are just below and above the specified range.
If expandedRange is true but there are no data points above sortKey, the index just above the highest data point is returned.
If the container is empty, returns 0.
- See also
- findBegin, QCPDataContainer::findEnd
Implements QCPPlottableInterface1D.
◆ getKeyRange()
|
protectedvirtual |
Returns the coordinate range that all data in this plottable span in the key axis dimension.
For logarithmic plots, one can set inSignDomain to either QCP::sdNegative or QCP::sdPositive in order to restrict the returned range to that sign domain. E.g. when only negative range is wanted, set inSignDomain to QCP::sdNegative and all positive points will be ignored for range calculation. For no restriction, just set inSignDomain to QCP::sdBoth (default). foundRange is an output parameter that indicates whether a range could be found or not. If this is false, you shouldn't use the returned range (e.g. no points in data).
Note that foundRange is not the same as QCPRange::validRange, since the range returned by this function may have size zero (e.g. when there is only one data point). In this case foundRange would return true, but the returned range is not a valid range in terms of QCPRange::validRange.
- See also
- rescaleAxes, getValueRange
Implements QCPAbstractPlottable.
◆ getValueRange()
|
protectedvirtual |
Returns the coordinate range that the data points in the specified key range (inKeyRange) span in the value axis dimension.
For logarithmic plots, one can set inSignDomain to either QCP::sdNegative or QCP::sdPositive in order to restrict the returned range to that sign domain. E.g. when only negative range is wanted, set inSignDomain to QCP::sdNegative and all positive points will be ignored for range calculation. For no restriction, just set inSignDomain to QCP::sdBoth (default). foundRange is an output parameter that indicates whether a range could be found or not. If this is false, you shouldn't use the returned range (e.g. no points in data).
If inKeyRange has both lower and upper bound set to zero (is equal to QCPRange()), all data points are considered, without any restriction on the keys.
Note that foundRange is not the same as QCPRange::validRange, since the range returned by this function may have size zero (e.g. when there is only one data point). In this case foundRange would return true, but the returned range is not a valid range in terms of QCPRange::validRange.
- See also
- rescaleAxes, getKeyRange
Implements QCPAbstractPlottable.
◆ interface1D()
|
inlinevirtual |
If this plottable is a one-dimensional plottable, i.e.
it implements the QCPPlottableInterface1D, returns the this pointer with that type. Otherwise (e.g. in the case of a QCPColorMap) returns zero.
You can use this method to gain read access to data coordinates while holding a pointer to the abstract base class only.
Reimplemented from QCPAbstractPlottable.
◆ selectTest()
|
virtual |
This function is used to decide whether a click hits a layerable object or not.
pos is a point in pixel coordinates on the QCustomPlot surface. This function returns the shortest pixel distance of this point to the object. If the object is either invisible or the distance couldn't be determined, -1.0 is returned. Further, if onlySelectable is true and the object is not selectable, -1.0 is returned, too.
If the object is represented not by single lines but by an area like a QCPItemText or the bars of a QCPBars plottable, a click inside the area should also be considered a hit. In these cases this function thus returns a constant value greater zero but still below the parent plot's selection tolerance. (typically the selectionTolerance multiplied by 0.99).
Providing a constant value for area objects allows selecting line objects even when they are obscured by such area objects, by clicking close to the lines (i.e. closer than 0.99*selectionTolerance).
The actual setting of the selection state is not done by this function. This is handled by the parent QCustomPlot when the mouseReleaseEvent occurs, and the finally selected object is notified via the selectEvent/ deselectEvent methods.
details is an optional output parameter. Every layerable subclass may place any information in details. This information will be passed to selectEvent when the parent QCustomPlot decides on the basis of this selectTest call, that the object was successfully selected. The subsequent call to selectEvent will carry the details. This is useful for multi-part objects (like QCPAxis). This way, a possibly complex calculation to decide which part was clicked is only done once in selectTest. The result (i.e. the actually clicked part) can then be placed in details. So in the subsequent selectEvent, the decision which part was selected doesn't have to be done a second time for a single selection operation.
You may pass 0 as details to indicate that you are not interested in those selection details.
- See also
- selectEvent, deselectEvent, mousePressEvent, wheelEvent, QCustomPlot::setInteractions
Implements QCPAbstractPlottable.
◆ selectTestRect()
|
virtual |
Returns a data selection containing all the data points of this plottable which are contained (or hit by) rect.
This is used mainly in the selection rect interaction for data selection (data selection mechanism).
If onlySelectable is true, an empty QCPDataSelection is returned if this plottable is not selectable (i.e. if QCPAbstractPlottable::setSelectable is QCP::stNone).
- Note
- rect must be a normalized rect (positive or zero width and height). This is especially important when using the rect of QCPSelectionRect::accepted, which is not necessarily normalized. Use
QRect::normalized()when passing a rect which might not be normalized.
Implements QCPPlottableInterface1D.
◆ setData() [1/3]
| void QCPErrorBars::setData | ( | const QVector< double > & | error | ) |
This is an overloaded member function, provided for convenience. It differs from the above function only in what argument(s) it accepts.Sets symmetrical error values as specified in error.
The errors will be associated one-to-one by the data point index to the associated data plottable (setDataPlottable).
You can directly access and manipulate the error bar data via data.
- See also
- addData
◆ setData() [2/3]
| void QCPErrorBars::setData | ( | const QVector< double > & | errorMinus, |
| const QVector< double > & | errorPlus | ||
| ) |
This is an overloaded member function, provided for convenience. It differs from the above function only in what argument(s) it accepts.Sets asymmetrical errors as specified in errorMinus and errorPlus.
The errors will be associated one-to-one by the data point index to the associated data plottable (setDataPlottable).
You can directly access and manipulate the error bar data via data.
- See also
- addData
◆ setData() [3/3]
| void QCPErrorBars::setData | ( | QSharedPointer< QCPErrorBarsDataContainer > | data | ) |
This is an overloaded member function, provided for convenience. It differs from the above function only in what argument(s) it accepts.Replaces the current data container with the provided data container.
Since a QSharedPointer is used, multiple QCPErrorBars instances may share the same data container safely. Modifying the data in the container will then affect all QCPErrorBars instances that share the container. Sharing can be achieved by simply exchanging the data containers wrapped in shared pointers:
If you do not wish to share containers, but create a copy from an existing container, assign the data containers directly:
(This uses different notation compared with other plottables, because the QCPErrorBars uses a QVector<QCPErrorBarsData> as its data container, instead of a QCPDataContainer.)
- See also
- addData
◆ setDataPlottable()
| void QCPErrorBars::setDataPlottable | ( | QCPAbstractPlottable * | plottable | ) |
Sets the data plottable to which the error bars will be applied.
The error values specified e.g. via setData will be associated one-to-one by the data point index to the data points of plottable. This means that the error bars will adopt the key/value coordinates of the data point with the same index.
The passed plottable must be a one-dimensional plottable, i.e. it must implement the QCPPlottableInterface1D. Further, it must not be a QCPErrorBars instance itself. If either of these restrictions is violated, a corresponding qDebug output is generated, and the data plottable of this QCPErrorBars instance is set to zero.
For proper display, care must also be taken that the key and value axes of the plottable match those configured for this QCPErrorBars instance.
◆ setErrorType()
| void QCPErrorBars::setErrorType | ( | ErrorType | type | ) |
Sets in which orientation the error bars shall appear on the data points.
If your data needs both error dimensions, create two QCPErrorBars with different type.
◆ setSymbolGap()
| void QCPErrorBars::setSymbolGap | ( | double | pixels | ) |
Sets the gap diameter around the data points that will be left out when drawing the error bar backbones.
This gap prevents that error bars are drawn too close to or even through scatter points.
◆ sortKeyIsMainKey()
|
virtual |
Returns whether the sort key (dataSortKey) is identical to the main key (dataMainKey).
What the sort and main keys are, is defined by the plottable's data type. See the QCPDataContainer DataType documentation for details about this naming convention.
Implements QCPPlottableInterface1D.
The documentation for this class was generated from the following files:
- qcustomplot.h
- qcustomplot.cpp